Byers, J.A. 1992. Optimal fractionation and bioassay plans for isolation of synergistic chemicals: the subtractive-combination method. Journal of Chemical Ecology 18:1603-1621. pdf

Attraction of bark beetles (Ips paraconfusus) to aggregation pheromone released upwind in a laboratory olfactometer.
Abstract-- Studies of chemical ecology ot an organism are founded on the isolation and identification of a semiochemical, often comprised of two or more synergistic compounds (each synergist alone has little activity, but presented together they are bioactive). Chromatographic fractionation and bioassay methods of binary splitting, additive combination, and subtractive combination are compared for efficiency in isolating synergists. Formulas are derived for the latter two methods that calculate the expected number of bioassay tests required for isolation of from two to five synergists from biological extracts with any number of compounds, depending on the number of initial (major) chromatographic fractions. A computer program based on the formulas demonstrates the superiority of the subtractive-combination method. Simulations with the program were used to determine the optimal number of initial fractions for the additive- and subtructive-combination methods when isolating two to five synergists from extracts of from 25 to 1200 compounds. Methods of bioassay, isolation, identification, and field testing of semiochemicals are discussed.

Key Words-- Pheromone, semiochemical, behavioral bioassay, chemical isolation, gas chromatography, chemical fractionation, synergist.
Download PC software: SUBTRACT.ZIP or See

INTRODUCTION

Biological studies of olfactory perception, receptor biochemistry, pheromone biosynthesis, orientation behavior, and communication as well as many other areas require the use of the purified semiochemicals. Chemical ecology, in fact, is founded on the identification of chemicals that mediate the behavioral or physiological phenomena. The first step, however, is not the identification of the chemicals present in extracts of organisms but rather observation of the behavioral or physiological changes induced by chemical emissions in a vinually natural environment. For example, a specific mating behavior that appears to be elicited by odors from others of the species would indicate the presence of a pheromone. The next step is development of a bioassay, which consists of describing a consistent set of behavioral reactions and movements stimulated by the release of a suspected pheromone under controlled conditions.
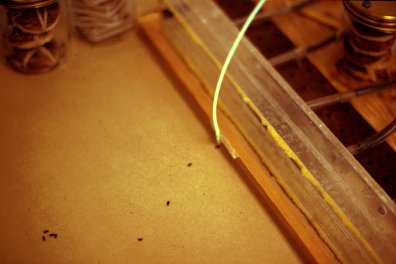
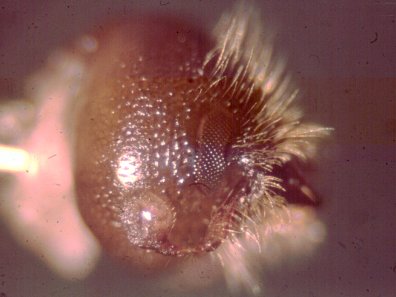
Bark beetles such as Ips paraconfusus detect aggregation pheromone components with their antennae. The laboratory bioassay (or olfactometer) for isolating semiochemicals of bark beetles allows the insects to walk about in an arena where a laminar air flow carries volatiles "downwind" and the beetles may orient toward the source of attractants.
The third step is then the isolation and identification of the chemicals comprising the pheromone. Most aggregation or sex pheromones of insects consist of two or more compounds that alone have moderate or no activity but released together are synergistic in eliciting maximum behavioral response (Silverstein and Young, 1976; Silverstein, 1981; Cardé and Baker, 1984; Byers, 1989). In Figure 1, a hypothetical chromatogram is shown of an insect extract in which three pheromone components (synergists) are depicted as eluting differently. The problem is to find efficient methods for locating them for subsequent chemical identification.

Behavioral tests (bioassays) can be coupled to chemical separation techniques and fractionation of biological extracts with several methods. One common method could be described as binary splitting. The extract is fractionated into two parts and each tested for activity. This method either assumes that only one compound is active or that all active compounds are found in one fraction so it would not work well for synergists. However, a variation could be used as in Figure 1, where successive binary fractionation would be tested in combination with other active fractions using a combinative scheme. This method will be discussed subsequently.

Another scheme, developed in the 1960s during the pioneering isolation of bark beetle pheromones, is here called the additive-combination method (Silverstein et al., 1966, 1967, 1968). In principle, the method uses chromatography, for example, gas chromatography (GC), to separate chemicals as they elute sequentially into fractions. The fractions then can be recombined and tested for behavioral activity in a bioassay. Silverstein et al. (1967) drew attention to the "notable feature" of the pheromone isolation work on the North American bark beetle, Ips paraconfusus, where attractant activity disappeared upon fractionation but reappeared upon recombination of appropriate fractions. They state that "no fraction can be discarded until it has been tested in combination with the other fractions." The exact methodology is unclear, but it can be assumed that all fractions would be tested individually first, then in two-way combinations, then three-way, and so forth in an additive-combination procedure. This method has been used on other important beetle species for isolation of their pheromone components: western pine beetle, Dendroctonus brevicomis (Silverstein et al., 1968), smaller elm bark beetle, Scolytus multistriatus (Pearce et al., 1975), and flat grain beetle, Cryptolestes pusillus, (Millar et al., 1985). However, because of the large number of combinations possible, relatively few other studies have attempted isolation of components using the additive-combination method due to the work involved.

A third method, subtractive-combination, also assumes that synergistic fractions must be tested in combination, but instead of combining smaller numbers of fractions together, it subtracts fractions from the whole blend of fractions. In 1976 L.E. Browne, while at the University of California, Berkeley, proposed that this method would be more efficient than the established method of additive combination of fractions (personal communication). My colleagues and I later used the subtractive-combination method for isolation of host (Scots pine) attractants of the pine shoot beetle, Tomicus piniperda, of Europe (Byers et al., 1985). However, the subtractive method was first used for isolation of synergistic pheromone components on the smaller spruce engraver of Europe and Asia, Pityogenes chalcographus, where a pheromonal structure not previously known for bark beetles, methyl (E,Z)-2,4-decadienoate, was identified (Byers et al., 1988, 1989, 1990a).

The objective of this paper is to describe and compare the three methods, especially the additive- and subtractive-combination methods. The question is which of the methods is most efficient in terms of number of bioassay tests required and number of passes of compounds through the chromatograph. Assuming two fractionations, mathematical formulas will be derived for both the additive- and subtractive-combination methods that describe the probabilistic number of tests that would be required to ensure isolation of all active components given: (1) the number of fractions of the extract on the first fractionation, (2) the number of synergistic components, and (3) the number of total compounds in the extract. A computer program that uses the formulas will determine the optimal number of initial major fractions, which depends on the number of total compounds in the extract and the number of synergists.

MATERIALS AND METHODS

Descriptive examples of binary splitting and additive- and subtractive-combination procedures are presented to explain the methodology used for each. Hypothetically, an extract consisting of 20 compounds can be passed through a gas chromatograph (GC) resulting in the "chromatogram" shown in Figures 1 and 2. It is assumed that the third, fifteenth, and nineteenth eluting compounds are active only in synergism. The first method of binary splitting of fractions is outlined in Figure 1. Fractions A and B alone are not active; the conclusion is that both have synergists. Fraction A is divided into C and D and these fractions are combined with B in order to isolate the active compounds in A (Figure 1).

FIG. 1. Outline of the binary splitting method for isolation of synergistic chemicals. The peaks represent a chromatogram with three synergists indicated by the asterisks. Letters represent fractions, see text for details.

Fraction C is active, D is not active, and further splitting of C into E and F (active), then F into I (active) and K, and finally I into L (active) and M reveals that L is a synergist. Fraction B is then fractionated similarly, with fractions tested with L (Figure 1) until the active compounds S and Y are found.

The second method, additive combination (Figure 2), fractionates the extract initially into four major fractions A-D. These are tested alone (none active), in binary combinations (none active) and then tertiary combinations (only ACD active). Next, fraction A is fractionated into five fractions and each tested with fractions C and D--showing that compound G is active. The same procedure is done with major fraction C, combining each minor fraction with G to find compound S active.


FIG. 2. Outline of the additive-combination and subtractive-combination methods for isolation of synergistic chemicals. The peaks represent a chromatogram with three synergists indicated by the asterisks. Letters represent fractions, see text for details.

Initially, major fraction D is fractionated and these minor fractions combined with G and S to find compound W active.

The third method, subtractive combination (Figure 2), also fractionates the extract into four initial fractions A-D, but the fractions are combined into four blends each with one of the fractions not present (subtracted). Since the removal of fraction B had no effect on the activity, it is concluded that this fraction does not contain synergists. Fractions A, C, and D when subtracted from the blend resulted in a loss of activity, so each has synergists. Fraction A is fractionated into five fractions, which are combined and tested with major fractions C and D in five tests, with a different minor fraction subtracted. Subtraction of minor fraction G results in a loss of activity, indicating that compound G is a synergist. Similar fractionation and testing of major fraction C with D and G shows S active, and fractionation of D reveals that W is active.

Using the schemes shown in Figure 2, two equations (1 and 2, see Results) were derived that describe the number of bioassay tests that are required to ensure that all possible bioactive compounds are isolated using the additive- or subtractive-combination methods. The formulas assume that the extract is fractionated once into any number of major fractions (from two to the number of compounds), that these fractions are bioassayed, and that any of the indicated active fractions are fractionated into individual compounds (the second fractionation). The two formulas, however, are somewhat unrealistic since most insects do not have any number of possible synergists but usually from two to five. It also must be considered that the active compounds will have various probabilities of being together or separated in the major fractions depending on (1) the number of synergists, and (2) the number of these fractions.

Formulas were derived that describe the probabilities of from two to five synergistic compounds being contained together, each separate, or in various combinations given any number of initial major fractions (see Results). The probabilities that all synergists elute together or separately were obtained from McCall (1970). The combinatorial notation used here is the following:
All combinations of three things selected from five=C53=5!
--------------
3! (5 - 3)!
=10

All permutations of three things selected from five=P53=5!
--------------
(5 - 3)!
=60

The probability formulas were combined with equations 1 and 2 (Results) for calculating the number of bioassay tests for the additive- and subtractive- combination methods. The resulting formulas, shown in Table 1, describe the expected number of tests that would be required to isolate from two to five synergists for any number of initial major fractions, the indicated number of bioactive major fractions, and for any number of compounds in the extract. The formulas were implemented in a BASIC language computer program (output shown in Figure 3). The program was used to obtain the expected number of tests required to isolate from two to five synergists in an extract of 60 compounds (Figure 4), or three synergists in extracts of 60-240 compounds (Figure 5), for each method. The program also generated the expected tests required to isolate two to five synergists from extracts of 25-1200 compounds (in steps of 25) using fractionations of 3-80 major fractions (fraction simulation run) for a total of 77 x 48 x 4 = 14,784 comparisons for each method. The minimum values for each fraction simulation run (total of 48 x 4 = 192) for each method, which are the optimal number of major fractions, were plotted in Figure 6 using geometric least-squares regression.

RESULTS

In Figure 1, the binary splitting method required 23 tests to isolate, in theory, the three synergists, compounds L, S and Y. The additive-combination method required 30 tests to isolate the three synergists, while the subtractive-combination procedure needed only 20 tests (Figure 2). However, the binary splitting method required 11 GC fractionation passes, while the additive- and subtractive-combination needed only two GC passes (at most four passes if each active fraction is fractionated separately).

The required number of tests to ensure the identification of all possible synergists using the additive-combination method and two fractionations is given by the following formula:

(1)

where f = number of major fractions of the first fractionation, a = number of active major fractions, and v = average number of compounds per major fraction. The required number of tests to ensure identification of any number of possible synergists using the subtractive-combination method and two fractionations is:

(2)

The above formulas for calculating the number of bioassay tests assumes there is no limit on the number of synergists, since this is something that is not known prior to the study. However, it can be assumed that most studies of insect pheromones will encounter no more than two to five synergists responsible for a particular behavior. Thus, probabilities must be derived for the expected distribution of synergists among the major fractions. Intuitively, if the number of major fractions is small and the number of synergists is five, then the probability that several synergists would occur together in one fraction is large. If the number of fractions is large, then the probability is larger that each synergist is found alone in a fraction.

In the case of two synergists, they can occur either together in one fraction or each alone in a fraction. For three synergists there are three possibilities, each alone (1 + 1 + 1), two together and one alone (2 + 1) and all together (3). Four synergists can occur in five ways, (1 + 1 + 1 + 1), (2 + 1 + 1), (3 + 1), (2 + 2), and all together (4), assuming there are at least four fractions. Five synergists may be distributed in seven ways, ( 1 + 1 + 1 + l + I ), (2 + 1 + 1 + 1 ), (3 + 1 + 1 ), (4 + 1 ), (2 + 2 + 1 ), (2 + 3), and all together (5). The probability (p) that synergists occur each alone in a fraction is given by formula (a) below. The formula for the probability that all synergists occur together in a fraction is given in (b).


where f is the number of major fractions and r is the number of synergists (P represents permutations). The probability that the synergists are distributed as ( j + 1), ( j + 1 + 1) or ( j + 1 + 1 + 1), where j is 2, 3, or 4, is given by the general formula in (c), while the probability of the synergists occurring as ( j + 2) is given in (d) below.


where C represents combinations, r is as above and k is the number of synergists alone (e.g., 1-3). For synergists distributed as (2 + 2), the probability can be calculated from equation (e) below. Finally, the probability that the synergists could be distributed as (2 + 2 + 1) is given by equation ( f ) below:


The probability formulas (a-f) above can be used with equations 1 and 2 to calculate the expected number of bioassay tests required to isolate from two to five synergists, for any number of major fractions, and for any number of compounds in the extract for the additive- and subtractive-combination methods (see Table 1).
Table 1. Expected number of bioassay tests required for isolation of two to five synergists in extracts of any number of compounds (n) and with initial fractionation into any number of fractions (f)a
Two synergists
Additive-combination tests = 1 + p2C1f + p1+1[SUM i=1 to 2]Cif + p2[SUM i=1 to 2]Cin + p1+12C1n
Subtractive-combination tests = 1 + f + p2C1n + p1+12C1n
Three synergists
Additive-combination tests = 1 + p3C1f + p2+1[SUM i=1 to 2]Cif + p1+1+1[SUM i=1 to 3]Cif + p3[SUM i=1 to 3]Cin+ p2+1{ [SUM i=1 to 2]Cin + C1n} + p1+1+13C1n
Subtractive-combination tests = 1 + f + p3C1n + p2+12C1n + p1+1+13C1n
Four synergists
Additive-combination tests = 1 + p4C1f + p3+1[SUM i=1 to 2]Cif + p2+2[SUM i=1 to 2]Cif + p2+1+1[SUM i=1 to 3]Cif + p1+1+1+1[SUM i=1 to 4]Cif + p4[SUM i=1 to 4]Cin + p3+1{ [SUM i=1 to 3]Cin + C1n} + p2+2{ [SUM i=1 to 2]Cin + [SUM i=1 to 2]Cin} + p2+1+1{ [SUM i=1 to 2]Cin + 2C1n} + p1+1+1+14C1n
Subtractive-combination tests = 1 + f + p4C1n + p3+12C1n + p2+22C1n + p2+1+13C1n + p1+1+1+14C1n
Five synergists
Additive-combination tests = 1 + p5C1f + p4+1[SUM i=1 to 2]Cif + p3+2[SUM i=1 to 2]Cif + p3+1+1[SUM i=1 to 3]Cif + p2+2+1[SUM i=1 to 3]Cif + p2+1+1+1[SUM i=1 to 4]Cif + p1+1+1+1+1[SUM i=1 to 5]Cif + p5[SUM i=1 to 5]Cin + p4+1{ [SUM i=1 to 4]Cin + C1n} + p3+2{ [SUM i=1 to 3]Cin + [SUM i=1 to 2]Cin} + p3+1+1{ [SUM i=1 to 3]Cin + 2C1n} + p2+2+1{2[SUM i=1 to 2]Cin + C1n} + p2+1+1+1{ [SUM i=1 to 2]Cin + 3C1n} + p1+1+1+1+15C1n
Subtractive-combination tests = 1 + f + p5C1n + p4+12C1n + p3+22C1n + p3+1+13C1n + p2+2+13C1n + p2+1+1+14C1n + p1+1+1+1+15C1n
aThe probabilities of various combinations of synergists occurring together in fractions are represented as p1+1 etc. (see Results). The letter C represents the notation for combinations (see Methods and Materials).
Output of a computer program (Figure 3) using the equations of Table 1 shows that the expected number of tests needed to isolate four synergists from an extract of n = 200 compounds and f = 7 major fractions with the additive method is 788 while the subtractive method requires only 101 tests.


FIG. 3. Output of a computer program that calculates the tests required to isolate the number of synergists entered (4) for the number of compounds entered (200) for up to 100 major fractions (N) for the subtractive-combination and additive-combination methods. The columns headed by P:4, P:3 + I, etc., represent the probabilities that all four synergists occur in one fraction, or three synergists in one and the other in another fraction, respectively.

The computer program was used to vary Ihe number of major fractions and calculate the number of tests required to isolate from two to five synergists in an extract of 60 compounds for each method (Figure 4).

FIG. 4. The number of tests required to isolate from two to five synergists from an extract with 60 compounds with either the additive- or subtractive-combination methods, depending on the number of major fractions.

From Figure 4 it can be seen that the minimum number of tests is most likely to occur at about six major fractions for the additive-combination method, while the minimum for the subtractive-combination method is ill-defined but occurs with higher numbers of major fractions. It is clear that in all cases the subtractive-combination method requires less tests than the comparable conditions with the additive method (Figure 4). The effect of varying the number of compounds in the extract when attempting to isolate three synergists is seen in Figure 5.

FIG. 5. The numher of tests required to isolate three synergists from extracts with 60- 240 compounds with either the additive- or subtractive-combination methods, depending on the number of major fractions.

Again there are optimal numbers of major fractions, i.e., for higher number of compounds in the extract the optimal number is larger. Again, however, in all cases, the subtractive-combination method is superior since it requires fewer biological tests.

The results of finding the minimum tests needed to isolate from two to five synergists for fractionations with from a few to 80 major fractions, for extracts from 25 to 1200 compounds, is shown in Figure 6. As the number of compounds per extract increases, the optimal number of major fractions increases for both methods. The number of synergists has little eftcct on the optimal number of fractions for the additive method, while an increasing number of synergists reyuires an increasing number of fractions for the subtractive method (Figure 6).

FIG. 6. The optimal number of major fractions for isolation of from two to five synergists from extracts with up to 1200 compounds using either the additive- or subtractive- combination methods.

DISCUSSION

In regard to insect semiochemicals, there are two major bioassay methods in use today for isolation of components: ( 1 ) electrophysiological and (2) behavioral. The electronic recording of voltages at the electroantennogram, single-sensillum, or single-cell level has the advantage that it is consistently reproducible and more quantitative than behavioral observations. On the other hand, behavioral tests by their very nature are more descriptive of the actual phenomena of interest. Single-sensillum and single-cell electrophysiological recordings are dependent on the neuronal entities being tested. Of the literally thousands of sensillar cells on an insect (e.g., locusts: Greenwood and Chapman, 1984; Blaney and Simmonds, 1990), it is quite possible that various sensilla involved in a particular behavior could be overlooked and thus not probed. For example, in the moth, Agrotis segetum, of the receptor cells responding to one of the three pheromone components, only 2% were specialized to the Z9-14: Ac component (Van Der Pers and Löfstedt, 1986).

Another disadvantage is that some insects such as locusts (Blaney and Simmonds, 1990) and bark beetles (Dickens et al., 1985; Lanne et al., 1987) contain either many generalist receptors or (more likely) many different kinds of more specialized receptors, since many chemicals elicit voltage potentials in the electroantennogram. This makes it more difficult to determine the importance of candidate chemicals to a specific behavior. Furthermore, synergism among pheromone components is not generally observed at the peripheral, antennal level, but in the realm of the brain (Mustaparta et al., 1980; cf. Byers, 1989; cf. Baker, 1989). The electrophysiological techniques thus are not truly rigorous when it comes to isolation of a pheromone that is usually a blend of synergistic chemicals (Silverstein and Young, 1976; Silverstein, 1981 ).

Using a computer program (Byers, 1992), I searched the titles, key words, and abstracts of all articles in the Journal of Chemical Ecology in 1990 (281 papers downloaded from BIOSIS Previews). Of the 182 papers on insects (65 %), about 93 studies identified compounds in biological extracts. Of these papers, 34 studies primarily described chemicals found in extracts without ascribing bioactivity to individual compounds (e.g., Brown et al., 1990), eight studies used a combination of GC and electroantennogram (EAG) methods (e.g., Millar et al., 1990), while 51 studies identified one or more compounds and reported their biological activity. However, the majority of these latter studies appear to have selected compounds for bioassay based on whether they were: (1) major constituents of the extract (e.g., Riba et al., 1990; Sreng, 1990), (2) unique to male or female (e.g., Duffield et al., 1990), or (3) previously known to have activity in other species (e.g., Briggs, 1990). Thus many of these studies can be criticized as being biased since they do not treat all compounds equally but single out certain ones for special treatment-with the probability that many ecologically relevant compounds are overlooked (until possibly a later study). Less than half the studies fractionated extracts, and it appears that very few reports used additive- or subtractive-combination methods to rigorously test for synergists. A search of all 281 papers also found that only 12 mentioned synergist, synergism, or synergistic. Of these, only six papers actually identified chemicals (2%)-three used additive or subtractive fractionation methods and three used comparative methods. Therefore, this indicates there is a need for a better understanding of the rationale and methods for isolation of semiochemicals so that more rigorous and complete studies can be done in the future.

The binary splitting method of fractionation has been used since the beginning of isolation studies. The fractions were not always split in two equal parts but into two solvent fractions with different polarities, or each "active" fraction was successively fractionated (e.g., Imai et al., 1990). The general assumption was that one chemical was responsible for the biological phenomenon (or alternatively that all synergists would fortuitously be contained in one fraction). This assumption is evident in work on isolation of insect host stimulants (e.g., in 1985: Dicke et al., 1985; Stubbs et al., 1985; McKibben et al., 1985; and in 1990: Shu et al., 1990) and ovipositional stimulants (e.g., in 1985: Maeshima et al., 1985; Kim et al., 1985; Hanula et al., 1985; and in 1990: Honda, 1990; Takahashi et al., 1990). The bioassay problem with host stimulants is not as severe as with pheromone components since quite often the former each have significant activity alone, although additive. Many times researchers have assumed, often correctly, that the chemicals with the largest quantities were bioactive, e.g., in isolation of locust pheromones (Nolte et al., 1973; Fuzeau-Braesch et al., 1988). The lack of tests for synergism may be one reason that locust pheromones have yet to be identified satisfactorily (cf. Byers, 1991).

With the finding that most insect pheromones consisted of two or more synergists, it becomes necessary to modify the binary method as in Figure 1. However, I was unable to find any use of the modified binary method in articles in the Journal of Chemical Ecologv. The method is efFlcient in terms of bioassay tests required (Figure 1), but the large number of chromatographic passes (e.g., 11) is a disadvantage. At present, most insect pheromones are isolated with the use of GC, and multiple passes often cause the loss of biological activity due to gradual thermal breakdown of the compounds and to their adsolption on glass walls and chromatographic packing.

The additive- and subtractive-combination methods are both efficient in terms of fewer chromatographic passes (e.g., two to four passes, Figure 2). However, the subtractive-combination method requires fewer tests to isolate from two to five synergists in all possible ways to initially fractionate (Figure 4). There also is very little dift'erence in the number of required tests regardless of the number of synergists that must be isolated, in contrast to the additive method where large differences occur (Figure 4). The number of compounds in the extract affects the number of tests required in both methods, but the effect is much larger with the additive method (Figure 5).

The inflection points (troughs) in the curves are the optimal fractionation numbers, and they have been used in the power regressions in Figure 6. It is apparent that for the additive method there should be no less than five major fractions and no more than about the optimal number. For the subtractive method, the number of major fractions is not too important above five fractions. The optimal number (Figure 6) is, in fact, not critical since the curves are almost flat (Figure 5). The chemist must compromise between what is reasonable to fractionate (lower number of fractions) and the optimal number (usually a higher number). Of course, extracts with compounds that substitute for one another in activity will require fewer tests (with any method) to find a blend that is competitive in nature.

One of the more commonly used techniques for isolation of semiochemicals is called "differential diagnosis" (Vité and Renwick, 1971). With this method, the chemical elution patterns from the GC are compared between the sexes for unique differences. For example, the compounds found in male Ips paraconfusus, and which were not in the female, would be obtained commercially, by synthesis, or by up-scaling the isolation and then tested in the field. However, there are three major problems with this approach: (1) a unique pheromone component may not be discriminated from other compounds with the present GC column, (2) a pheromone component may be present in both sexes (e.g., cis-verbenol in l. paraconfusus; Renwick et al., 1976) and (3) the pheromone may consist of synergistic components, some of which are not unique or distinguishable, so that an incomplete blend would be tested with consequent failure to observe full activity.

In spite of these restrictions, the differential diagnosis method has allowed isolation of many pheromone components with a minimum of work, albeit with the consequence of some incomplete blends. Difterential diagnosis can be used in conjunction with the subtractive-combination method. For example, Byers et al. ( 1990a) used subtractive tests to isolate two synergistic pheromone components of P. chalcographus, but one of the synergists could not be resolved from coeluting compounds on the GC column used. Thus the fraction, and adjoining fractions, containing the synergist (bioassay activity) was passed through a second GC column of different polarity in order to separate the compounds differently and obtain new fractions. Subtractive tests with the new fractions located the synergist in one of the fractions. Differential diagnosis using GC-MS extracted ion current profiles then was used to compare the two fractions with bioassay activity from both GC columns to pinpoint the synergist that was common to both of the fractions.

In addition to chromatographic fractionation or differential diagnosis in conjunction with behavioral or electrophysiological bioassay, there is the widely used method of screening chemicals. The idea is to test previously identified pheromone components of closely related species on the species of interest (Booij and Voerman, 1985). This method is obviously the least rigorous of all but still can yield information, albeit often incomplete, on the pheromone components of a species. Of course the method relies on the use of the more rigorous chemical-fractionation and bioassay methods to identify the components in other related species. The screening method can be used in conjunction with chemical analyses of the insect to narrow the range of possibilities.

One problem with the screening method, and to a lesser extent with all methods, is that the quantities of component release must be close to natural rates in order to obtain an appropriate biological effect. Otherwise it is possible to either have too little (no response) or too much (confusion, inhibition, disruption). The ratio of the synergistic components may be very important as in the case of the E and Z isomers of straight chain hydrocarbons in moths (e.g., Argyrotaenia velutinana, Baker et al., 1976) or much less critical as in some bark beetles (D. brevicomis, Byers, 1988; I. typographus, Schlyter et al., 1987). De Jong ( 1987) describes a "direct search" method for determining the best blend of components given that the components are already identified. It is generally accepted that the optimal blend of components is that which approximates the ratio emitted by the organisms in nature (Cardé and Baker, 1984).

During the isolation study, or even when screening is done, the chemical amounts released should be known. The release rates of components in an extract or solvent fraction should be adjusted so that they reproduce approximately the rates of natural release that have been shown to be active. The diffusion-dilution method, where chemicals are released according to their mole percent in the solvent and the dimensions of the holding tube, is useful for laboratory and field bioassay (Byers, 1988). Other methods of adsorbents-wicks, capillary tubes, and semipermeable plastic membranes-have been used (cf. Byers, 1988; and review papers in Jutsum and Gordon, 1989; and Ridgway et al., 1990). Bengtsson et al. (1990) discusses a method for estimating the release of volatiles from adsorbents based on their vapor pressure.

Once the semiochemical components have been isolated and identified in the laboratory, it is important to verify their activity in the field. Ideally, the release rate should parallel the expected or measured rates of natural release (Byers et al., 1985). Usually, however, a range of rates that are expected to overlap the natural rate are used (Schlyter et al., 1987; Byers et al., 1988). As the release rate is increased, there is a point when activity begins (e.g., catch increases above the control), and this rate is assumed to be similar to the natural one. Of course, it is possible to erroneously conclude that a compound has activity when it does not if the compound is released at such high levels that minor impurities (such as pheromone components) elicit the behavior.

Field tests to confirm the activity of isolated semiochemical components are also sometimes difficult to interpret due to the natural variation in population density with respect to trap position and time (Payne et al., 1978). In many previous studies a line of traps was fixed in the field and treatments were randomized to confirm the semiochemical identification (e.g., Byers et al., 1985). In spite of the replication and randomization, it is possible to have nonhomogeneous variation, thus often invalidating the statistical tests used. A recent field test method, the mechanical slow rotation of a pair of traps, evens the catch variation in position and time to allow more powerful statistics and more sensitive discrimination of semiochemical blends (Byers et al., 1990b).

The subtractive-combination method provides the most efficient fractionation and bioassay plan for the rigorous isolation and identification of semiochemicals. The program for determining the optimal number of major fractions based on assumptions of number of compounds and synergists is available from the author for IBM-compatible personal computers (send a formatted disk and $5 for shipping).

JOHN A. BYERS
Department of Animal Ecology, Lund University, SE-223 62 Lund, Sweden
Present address:

Acknowledgements- I thank the Swedish Agricultural and Forest Research Council (SJFR) for financial support during the studies. Other support was provided by Jan Löfqvist and the pheromone group in Lund. I thank colleagues for review of the manuscript.

REFERENCES

BAKER, T.C. 1989. Sex pheromone communication in the Lepidoptera: New research progress. Experientia 45:248-262.

BAKER, T.C., CARDÉ, R.T., and ROELOFS, W.L. 1976. Behavioral responses of male Argyrotaenia velutinana (Lepidoptera: Tortricidae) to components of its sex pheromone. J. Chem. Ecol. 2:333-352.

BLANEY, W.M., and SIMMONDS, M.S.J. 1990. The chemoreceptors. pp. 1-37, in R.F. Chapman and A. Joern (eds.). Biology of Grasshoppers. John Wiley & Sons, New York.

BENGTSSON, M., LILJEFORS, T., HANSSON, B.S., LÖfSTEDT, C., and COPAJA, S.V. 1990. Structure-activity relationships for chain-shortened analogs of (Z)-5-decenyl acetate, a pheromone component of the turnip moth, Agrotis segetum. J. Chem. Ecol. 16:667-684.

BOOU, C.J.H., and VOERMAN, S. 1985. New lepidopteran sex attractants found by systematic field screening of blends containing (Z)-11-and (E)-11-tetradecenal. J. Chem. Ecol. 11:1333-1339.

BRIGGS, M.A. 1990. Relation of Spodoptera eridania choice to tannins and protein of Lotus corniculatus. J. Chem. Ecol. 16:1557-1564.

BROWN, V., JAISSON, P., TAYLOR, R.W., and LACEY, M.J. 1990. Novel internally branched, internal alkenes as major components of the cuticular hydrocarbons of the primitive Australian ant Nothomyrmecia macrops Clark (Hymenoptera: Formicidae). J. Chem. Ecol. 16:2623-2635.

BYERS, J.A. 1988. Novel diffusion-dilution method for release of semiochemicals: Testing pheromone component ratios on western pine beetle. J. Chem. Ecol. 14:199-212.

BYERS, J.A. 1989. Chemical ecology of bark beetles. Experientia 45:271-283.

BYERS, J.A. 1991. Pheromones and chemical ecology of locusts. Biol. Rev. 66:347-378. BYERS, J.A. 1992. Trends in chemical ecology revealed with a personal computer program for searching data bases of scientific references and abstracts. J. Chem. Ecol. 18:1481-1495.

BYERS, J.A., LANNE, B.S., SCHLYTER, F., LÖFQVIST, J., and BERGSTRÖM, G. 1985. Olfactory recognition of host-tree susceptibility by pine shoot beetles. Naturwissenschaften 72:324-326.

BYERS, J.A., BIRGERSSON, G., LÖFQVIST, J., and BERGSTRÖM, G. 1988. Synergistic pheromones and monoterpenes enable aggregation and host recognition by a bark beetle. Naturwissenschaften 75:153-155.

BYERS, J.A., HÖGBERG, H.E., UNELIUS, R., BIRGERSSON, G., and LÖFQVIST, J. 1989. Structure-activity studies on aggregation pheromone components of Pityogenes chalcographus (Coleoptera: Scolytidae): All stereoisomers of chalcogran and methyl 2,4-decadienoate. J. Chem. Ecol. 15:685-695.

BYERS, J.A., BIRGERSSON, G., LÖFQVIST, J., APPELGREN, M., and BERGSTRÖM, G. 1990a. Isolation of pheromone synergists of bark beetle, Pityogenes chalcographus, from complex insect-plant odors by fractionation and subtractive-combination bioassay. J. Chem. Ecol. 16:861-876.

BYERS, J.A., SCHLYTER, F., BIRGERSSON, G., and FRANCKE, W. 1990b. (E)-Myrcenol in Ips duplicatus: An aggregation pheromone component new for bark beetles. Experientia 46:1209-1211.

CARDÉ, R.T., and BAKER, T.C. 1984. Sexual communication with pheromones, pp. 355-383, in W.T. Bell and R.T. Cardé (eds.). Chemical Ecology of Insects. Chapman and Hall, New York.

DE JONG, M.C.M. I987. A direct search approach to characterize the sex pheromone composition giving maximal male response. Physiol. Entomol. 12:11-21.

DICKE, M., VAN LENTEREN, J.C., BOSKAMP, B.J.F., VAN VOORST, R. 1985. Intensification and prolongation of host searching in Leptopilina heterotoma (Thompson) (Hymenoptera: Eucoilidae) through a kairomone produced by Drosophila melanogaster. J. Chem. Ecol. 11:125-136.

DICKENS, J.C., PAYNE, T.L., RYKER, L.C., and RUDINSKY, J.A. 1985. Multiple acceptors for pheromonal enantiomers on single olfactory cells in the Douglas-fir beetle, Dendroctonus Pseudotsugae Hopk. (Coleoptera: Scolytidae. J. Chem. Ecol. 11:1359-1370.

DUFFIELD, R.M., SIMON-JORDAN, C., RIDDICK, E.W., and WHEELER, J.W. 1990. Exocrine secretions of bees X. 3,7-dimethyldeca-2,6-dien-1,1O-diol: A sex-specific compound from Nomada annulata (Hymenoptera: Anthophoridae). J. Chem. Ecol. 16:1069-1076.

FUZEAU-BRAESCH, S., GENIN, E., JULLIEN, R., KNOWLES, E., and PAPIN, C. I988. Composition and role of volatile substances in atmosphere surrounding two gregarious locusts, Locusta migratoria and Schistocerca gregaria. J. Chem. Ecol. 14:1023-1033.

GREENWOOD, M., and CHAPMAN, R.F. 1984. Differences in numbers of sensilla on the antennae of solitarious and gregarious Locusta migratoria L. (Orthoptera: Acrididae). Irt. J. Insect Morphol. Embryol. 13:295-301.

HANULA, J.L., BERISFoRD, C.W., and DEBARR, G.L. 1985. Monoterpene oviposition stimulants of Dioryctria amatella in volatiles from fusiform rust galls and second-year loblolly pine cones. J. Chem. Ecol. 11:943-952.

HONDA, K. 1990. Identification of host-plant chemicals stimulating oviposition by swallowtail butterfly, Papilio protenor. J. Chem. Ecol. 16:325-337.

IMAI, T., KODAMA, H., CHUMAN, T., and KOHNO, M. 1990. Female-produced oviposition deterrents of the cigarette beetle, Lasioderma serricorne (F.(Coleoptera: Anobiidae). J. Chem. Ecol. 16:1237-1247.

JUTSUM, A.R., and GORDON, R.F.S. 1989. Insect Pheromones in Plant Protection. John Wiley & Sons, New York.

KIM, M., KOH, H.S., and FUKAMl, H. 1985. Isolation of C-glycosylflavones as probing stimulant of planthoppers in rice plant. J. Chem. Ecol. 11:441-452.

LANNE, B.S., SCHLYTER, F., BYERS, J.A., LÖFQVIST, J., LEUFVÉN, A., BERGSTRÖM, G., VAN DER PERS, J.N.C., UNELIUS, R., BAECKSTRÖM, P., and NORIN, T. 1987. Differences in attraction to semiochemicals present in sympatric pine shoot beetles, Tomicus minor and T. piniperda. J. Chem. Ecol. 13:1045-1067.

MAESHIMA, K., HAYASHI, N., MURAKAMI, T., TAKAHASHI, F., and KOMAE, H. 1985. Identification of chemical oviposition stimulants from rice grain for Sitophilus zeamais Motschulsky (Coleoptera, Curculionidae). J. Chem. Ecol. 11:1-10.

McCALL, R.B. 1970. Fundamental Statistics for Psychology. Harcourt, Brace & World, New York. 419 pp.

McKIBBEN, G.H., THOMPSON, M.J., PARROTT, W.L., THOMPSON, A.C., and LUSBY. W.R. 1985. Identification of feeding stimulants for boll weevils from cotton buds and anthers. J. Chem. Ecol. 11:1229-1238.

MILLAR, J.G., PIERCE, H.D., JR., PIERCE, A.M., OEHLSCHLAGER, A.C., BORDEN, J.H., and BARAK, A.V. 1985. Aggregation pheromones of the flat grain beetle, Cryptolestes pusillus (Coleoptera: Cucujidae). J. Chem. Ecol. 11:1053-1070.

MILLAR, J.G., GIBLIN, M., BARTON, D., and UNDERHILL, E.W. 1990. 3Z,6Z,9Z-Trienes and unsaturated epoxides as sex attractants for geometrid moths. J. Chem. Ecol. 16:2307-2316.

MUSTAPARTA, H., ANGST, M.E., and LANIER, G.N. 1980. Receptor discrimination of enantiomers of the aggregation pheromone ipsdienol, in two species of Ips. J. Chem. Ecol. 6:689-701.

NOLTE, D.J., EGGERS, S.H., and MAY, I.R. 1973. A locust pheromone: Locustol. J. Insect Physiol. 19:1547-1554.

PAYNE, T.L., COSTER, J.E., RICHERSON, J.V., HART, E.R., HEDDEN, R.L., and EDSON, L.J. 1978. Reducing variation in field tests of behavioral chemicals for the southern pine beetle. J. G. Entomol. Soc. 13:85-90.

PEARCE, G.T., GORE;, W.E., SILVERSTEIN, R.M., PEACOCK, J.W., CUTHBERT, R.A., LANIER, G.N., and SIMEONE, J.B. 1975. Chemical attractants for the smaller European elm bark beetle, Scolytus multistriatus (Coleoptera: Scolytidae). J. Chem. Ecol. 1:115-124.

RENWICK, J.A.A., HUGHES, P.R., and KRULL, I.S. 1976. Selective production of cis- and trans-verbenol from (-)- and (+)-a-pinene by a bark beetle. Science 191:199-201.

RIBA, M., ROSELL, J.A., EIZAGUIRRE, M., CANELA, R., and GUERRERO. A. 1990. Identification of a minor component of the sex pheromone of Leucoptera malifoliella (Lepidoptera, Lyonetiidae). J. Chem. Ecol. 16:1471-1483.

RIGWAY, D.R., SILVERSTEIN, R.M., and INSCOE, M.N. 1990. Behavior-modifying Chemicals for Insect Management. Application of Pheromones and other Attractants. Marcel Dekker, New York.

SCHLYTER, F., BYERS, J.A., and LÖFQVIST, J. 1987. Attraction to pheromone sources of different quantity, quality and spacing: Density-regulation mechanisms in the bark beetle Ips typographus. J. Chem. Ecol. 13:1503-1523.

SHU, S., SWEDENBORG, P.D., and JONES, R.L. 1990. A kairnmone for Trichogramma nubilale (Hymenoptera: Trichogrammatidae) isolation, identification, and synthesis. J. Chem. Ecol. 16:521-529.

SILVERSTEIN, R.M. 1981. Pheromones: Background and potential for use in insect pest control. Science 213:1326-1332.

SILVERSTEIN, R.M., and YOUNG, J.C. 1976. Insects generally use multi-component pheromones, pp. 1-29, in M. Beroza (ed.). Pest Management With Insect Sex Attractants and Other Behavior-Controlling Chemicals. American Chemical Society Symposium Series, 23, Washington, D.C.

SILVERSTEIN, R.M., RODIN, J.O., and WOOD, D.L. 1966. Sex attractants in frass produced by male Ips confusus in ponderosa pine. Science 154:509-510.

SILVERSTEIN, R.M., RODIN, J.O., and WOOD, D.L. 1967. Methodology for isolation and identification of insect pheromones with reference to studies on Califomia five-spined Ips. J. Econ. Entomol. 60:944-949.

SILVERSTEIN, R.M., BROWNLEE, R.G., BELLAS, T.E., WOOD, D.L., and BROWNE, L.E. 1968. Brevicomin: Principal sex attractant in the frass of the female western pine beetle. Science 159:889-891.

SRENG, L. 1990. Seducin, male sex pheromone of the cockroach Nauphoeta cinerea: Isolation, identification, and bioassay. J. Chem. Ecol. 16:2899-2912.

STUBBS, M.R., CHAMBERS, J., SCHOFIELD, S.B., WILKINS, J.P.G. 1985. Attractancy to Orysaephilus surinamensis (L.) of volatile materials isolated from vacuum distillate of heat-treated carobs. J. Chem. Ecol. 11:565-581.

TAKAHASHI, S., HAJIKA, M., TAKABAYASHI, J., and FUKUI, M. 1990. Oviposition stimulants in the coccoid cuticular waxes of Aphytis yanonensis De Bach & Rosen. J. Chem. Ecol. 16:1657-1665.

VAN DER PERS, J.N.C., and LÖFSTEDT, C. 1986. Signal-response relationship in sex pheromone communication, pp. 235-24I, in T.L. Payne, M.C. Birch, and C.E.J. Kennedy (eds.). Mechanisms in Insect Olfaction. Clarendon Press, Oxford, U.K.

VITÉ, J.P., and RENWICK, J.A.A. 1971. Differential diagnosis and isolation of population attractants. Contrib. Boyce Thompson Inst. 24:323-328.

home page